 ROIX
FOREX - RISK OVER REGRET ROIX
FOREX - RISK OVER REGRET
ROIX
FOREX - RISK OVER REGRET ROIX
FOREX - RISK OVER REGRET
1.0 TYPES OF MARKET ANALYSIS
1.1 FUNDAMENTAL ANALYSIS
1.2 SENTIMENTAL ANALYSIS
1.3 TECHNICAL ANALYSIS
2.0 TYPES OF TRENDS
2.1 UPTREND
2.2 DOWNTREND
2.3 RANGE (SUPPORT AND RESISTANCE)
3.0 FUNDAMENTAL FACTORS
3.1 INFLATION
3.2 EMPLOYMENT
3.3 RETAIL SALES
3.4 ISM/PMI REPORTS
3.5 BUSINESS AND CONSUMER CONFIDENCE
3.6 HOUSING DATA
3.7 GROSS DOMESTIC PRODUCT (GDP)
3.8 INTEREST RATE
3.9 TRADE BALANCE
In
fast-emerging global financial market, to make consistent income, and
to become
a professional trader, it is essential to understand types of market
analysis
and it volatility in the first place.
There are three basic types of Market analysis: Fundamental, Sentimental and Technical.
If you like analysing social, economic, and political factors that affect supply and demand, fundamental analysis is for you! As a new trader, you may look at the economic calendar every morning before you start trading. There are news that move the market and some do not move the market. You may observe your chart when a new is released to see how it works. Nowadays, if you click on the detail of the news, you will nd an explanation of the new and how to interpret it. U.S. news affect the pairs with the USD. European countries’ news have an impact on the pairs with the EUR. Japanese news have an impact on the pairs with JPY. Canadian news have an impact on the pairs with CAD. And so on with all others countries. In the chapter three, I will explain how to trade the news with RSI indicator.
Sometimes it is not about the numbers, but how you feel, how do you figure out and trade Forex off of that? I recommend you to read books about how to control your emotions, Psychology of Traders, and other books of Mind-set. It will help you! But me I do not like to read, so I subscribe to podcasts and play it.
Technical Analysis is the framework in which traders study price movement. To have full comprehension in trading financial market, it is important to start with Technical analysis. The theory is that a person can look at historical price movement and determine the current trading conditions and potential price movement. The main evidence for using technical analysis is that, theoretically, all current market information is reflected in price. If price reflects all the information that is out there, then price action is all one would really need to make trade.
Now, have you ever heard the saying, “History tends to repeat itself ” ? Well, that is basically what technical analysis is all about! If the price level held as a key support or resistance in the past, traders will keep an eye out for it and base their trades around that historical price level.
Technical analysts look for similar patterns that have formed in the past, and will form trade ideas believing that price will act the same way that it did before.
In the world of currency trading, when someone says technical analysis, the first thing that comes to mind is a chart. Technical analysts use charts because they are the easiest way to visualize historical data! You can look at past data to help you spot trends and patterns which could help you find some great trading opportunities.
What’s more is that with all the traders who rely on technical analysis out there, these price patterns and indicator signals tend to become self-fulfilling. As more and more Forex Traders look for certain price levels and chart patterns, the more likely that these patterns will manifest themselves in the markets.
NB: DO NOT USE LOW TIME FRAMES TO DO YOUR TECHNICAL ANALYSIS. EACH MORNING USE D1 AND H4 TO DRAW YOUR LINES AND THEN USE H1 AND M30 TO LOOK FOR ENTRY POINTS.
There are two basic sorts of opportunity to make profit from trading Financial Market such as:
Trend: trend is usually categorized into two, Uptrend and Downtrend.
Range:
Support
and Resistance Lines.
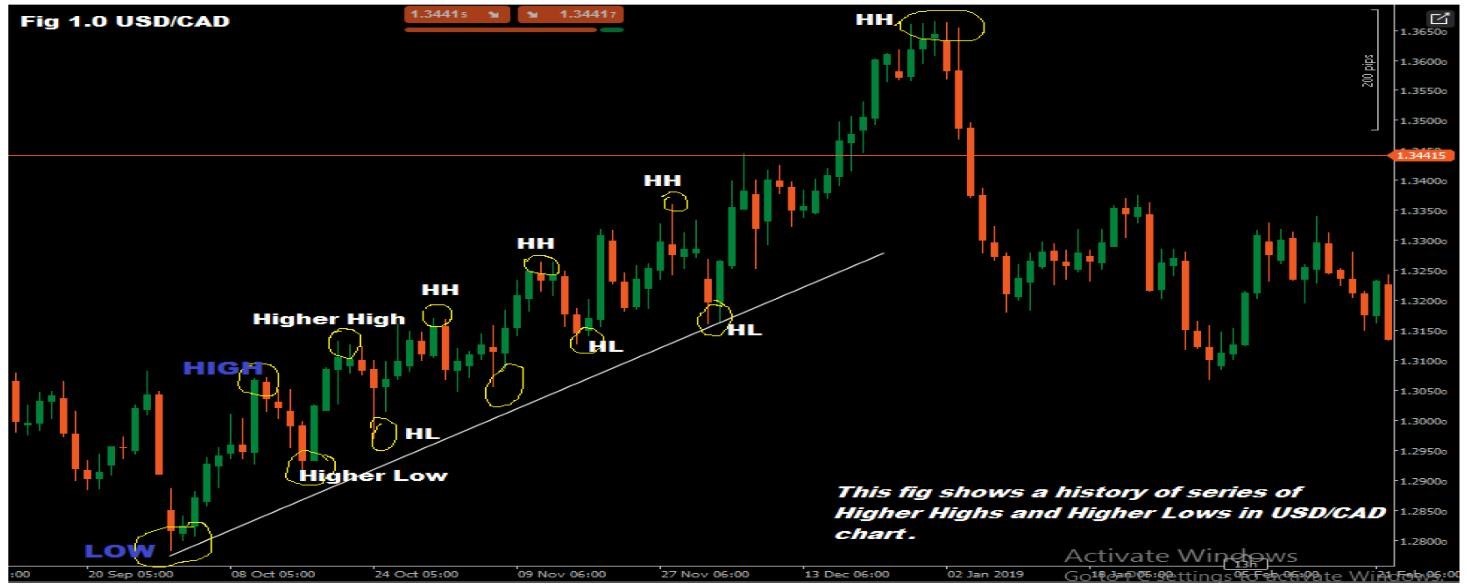
Uptrend is identified as prices having a series of Higher Highs and Higher Lows. The highs are the peaks that prices reach irregularly. Lows are the valleys that prices fall to before heading up again. Thus, an uptrend is formed when there is a series of Highs going higher and a series of Lows going higher. The figure below shows an example of price movement in uptrend.
Downtrend has prices moving in a series of lower highs and lows, the figure below shows an example of a chart moving in a downtrend.
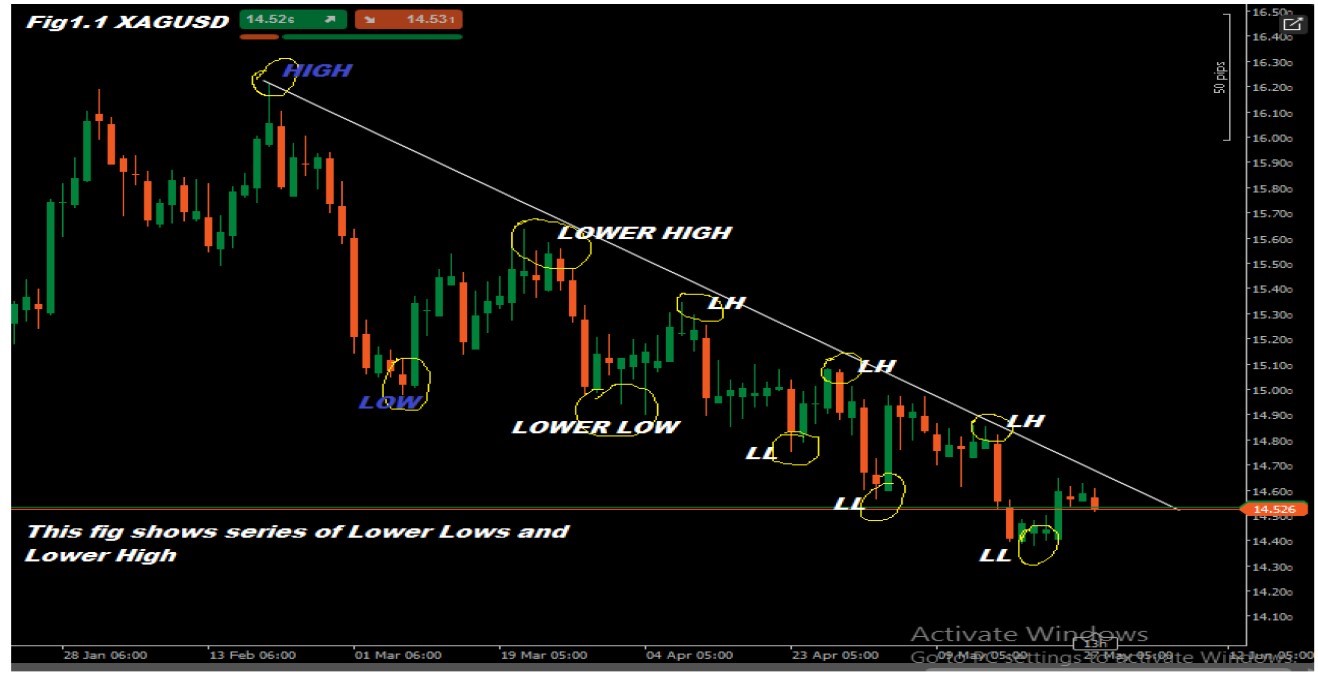
Traders use a trending strategy when the market is moving in an Uptrend or a Downtrend. When the market is in an Uptrend, we would place long position at the Higher Lows and when the market is moving in downtrend, we would place a short position at the Lower Highs.
WHY SHOULD I DRAW TREND LINES?
Trend lines are
lines that are drawn to show prevailing direction of prices. They are
visual
indication to provide us insight into where prices could go next. In an
Uptrend,
it is easy to summarize that prices could increase because there are
more
buyers than sellers. But this is not real case. In the financial
market,
trading Foreign Exchange, the number of contracts bought always equals
the
number of contracts sold.
For example, if
you want to buy 5 lots of USD/JPY currency, the contract must be
available from
someone who wants to sell it. Thus, the number of long and short
positions in
the financial market is always equal.
The
reason lies in the intensity of emotions between the buyers and the
sellers. In
an uptrend, the buyers are in control because they are willing to pay
higher
price. They buy high because they expect prices to rise even higher.
Sellers
are nervous in an uptrend and they agree to sell only at higher
price.The
price moves up because the intensity of buyers’ greed overpowers the
fear and
anxiety of the sellers. The uptrend starts to fail only when buyers
refuses to
buy at higher prices.
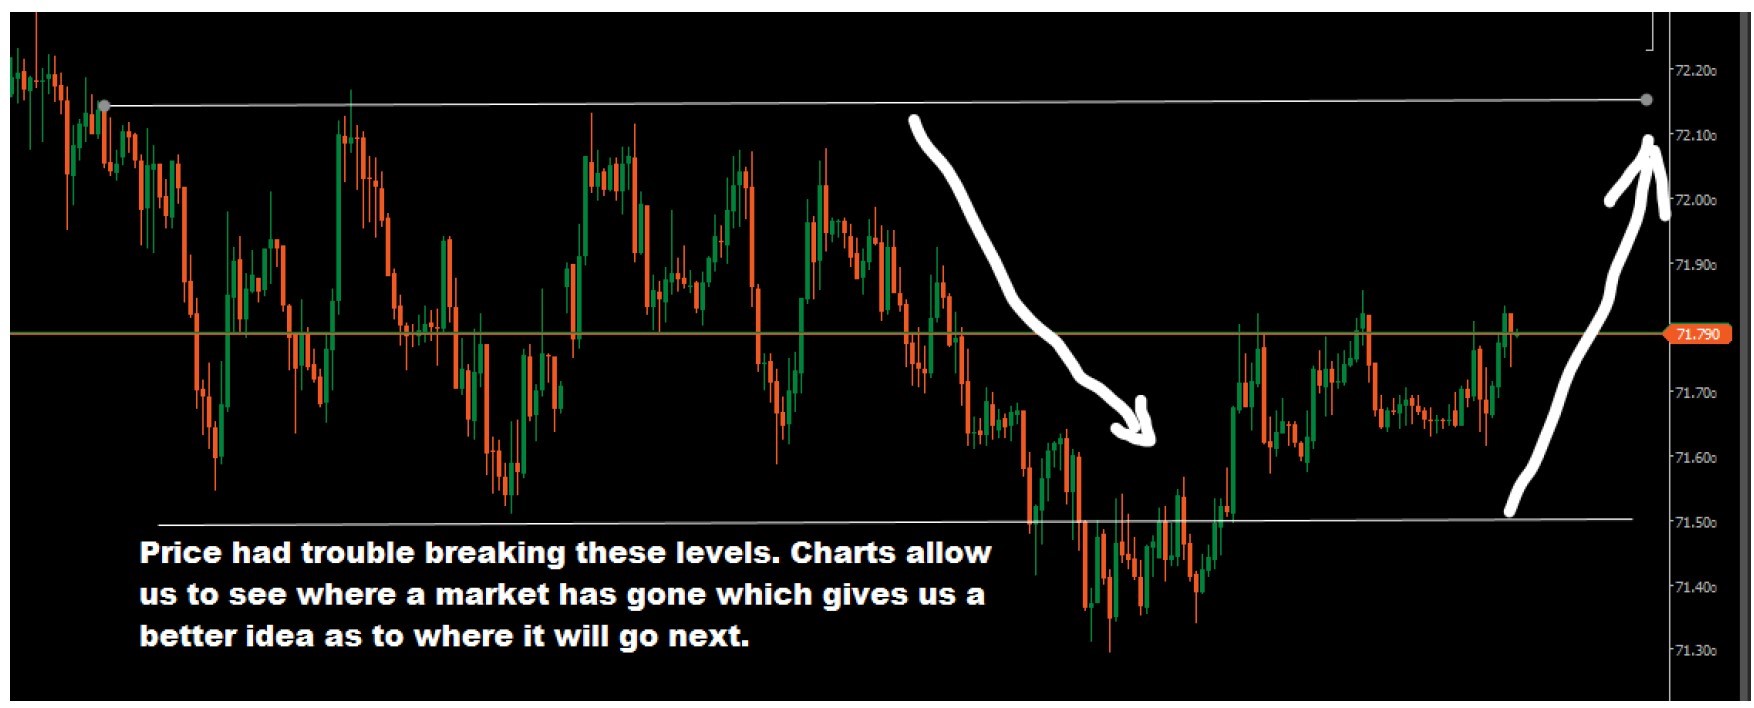
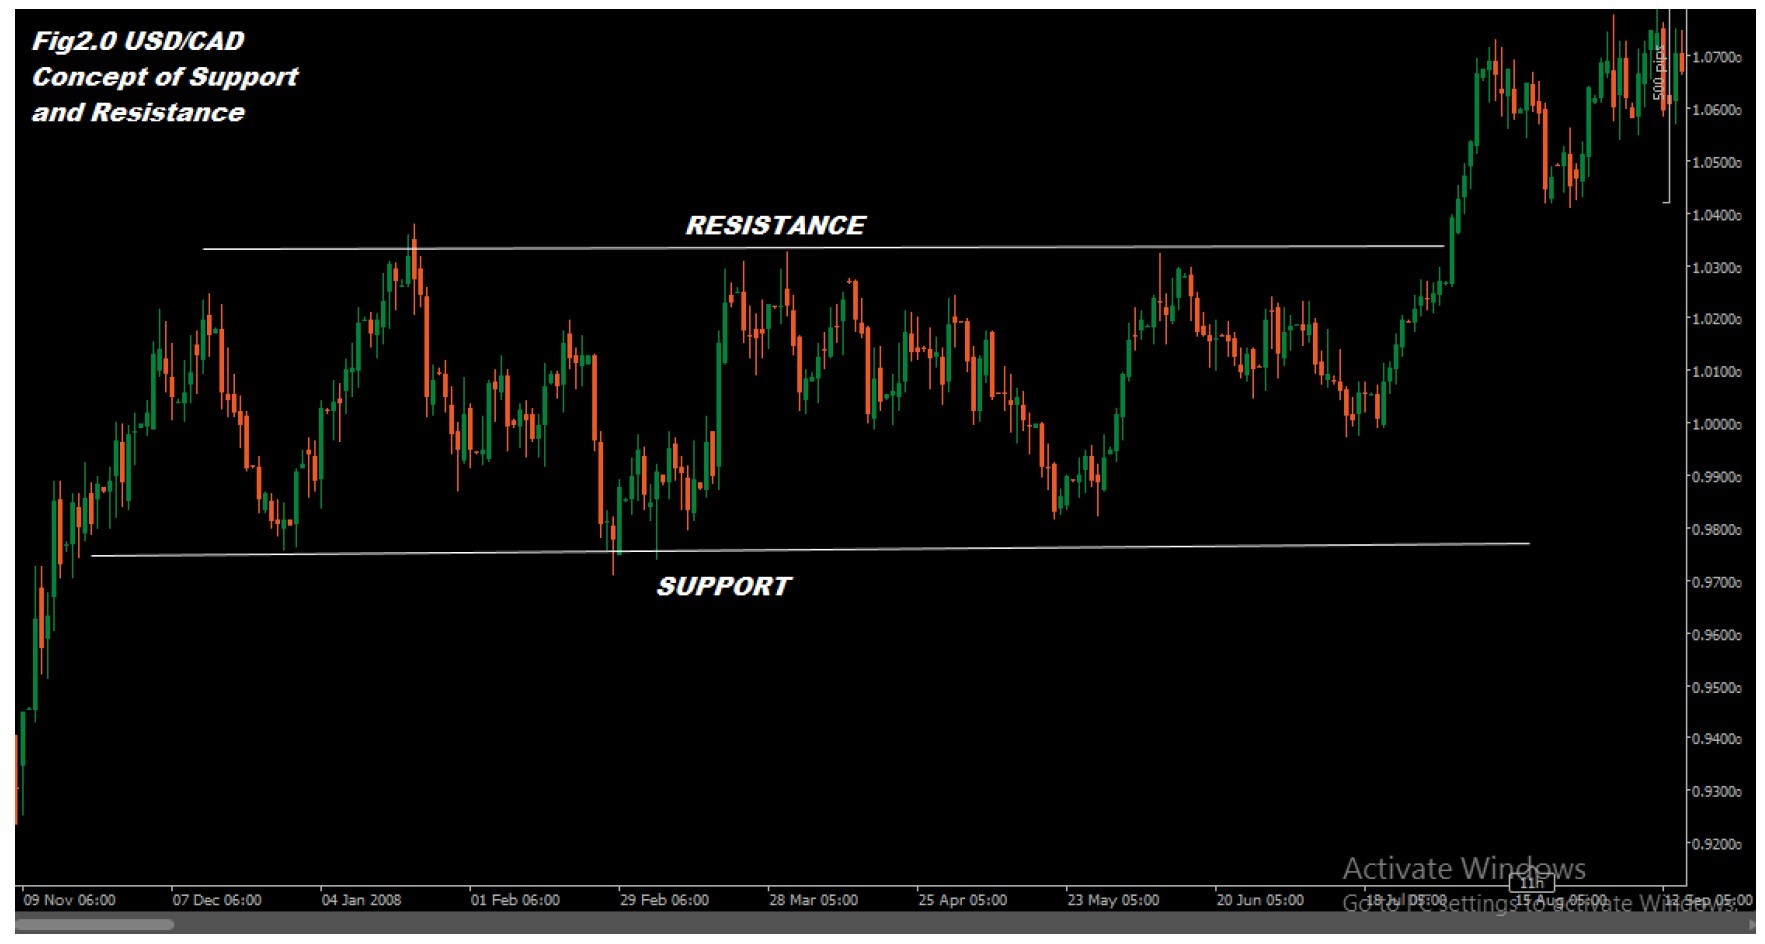
The bottom and the top of trade channels are named as Support and Resistance correspondingly. Resistance is a level at which the selling pressure exceeds the purchasing pressure. Support is a level at which the purchasing pressure exceeds to the selling pressure.
The
more prices bounce off the support and resistance, the stronger these
levels
become. But these levels will be broken through sooner or later, once a
strong
support is broken, that level is likely to turn into a strong
resistance. It is
important for the trader to consider these levels of conversion as it
can
assist in finding best zones to place your stop loss or profit target.
The
figure below shows an example of a ranging chart.
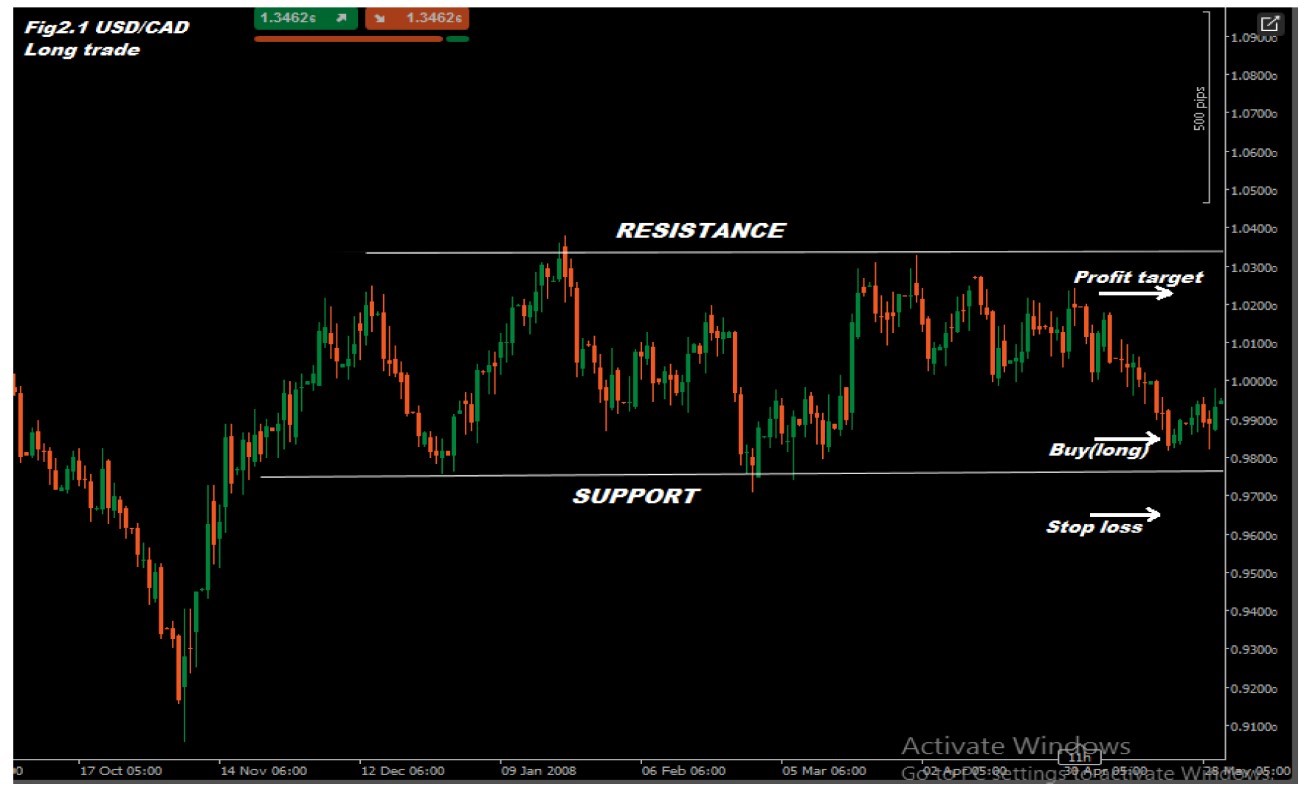
HOW DO I TRADE A SUPPORT AND RESISTANCE?
In order to
place best entries and exits through support and resistance, it is
important to
spot the start and end of support and resistance zones.
Long trade is
placed when a bull candle bounces of support level and closes above the
support
level. Then it is good to place a stop loss below the bottom of the
support
level as it is expected that chances of prices fall below that level is
unlikely. The take profit target may be placed about 80% of the range
measured
from the support level. It means that if the distance between support
and
resistance is 100 pips, the profit target is placed 80 pips away from
the
support. The risk and reward ratio is taken 1:1.
Thus the
distance between the entry price and the profit target is 50 pips, stop
loss
should be 50 pips from the entry price. Likewise, if the distance
between the
entry price of long position and target profit is 100 pips, the stop
loss
should be 100 pips from the entry of long position.
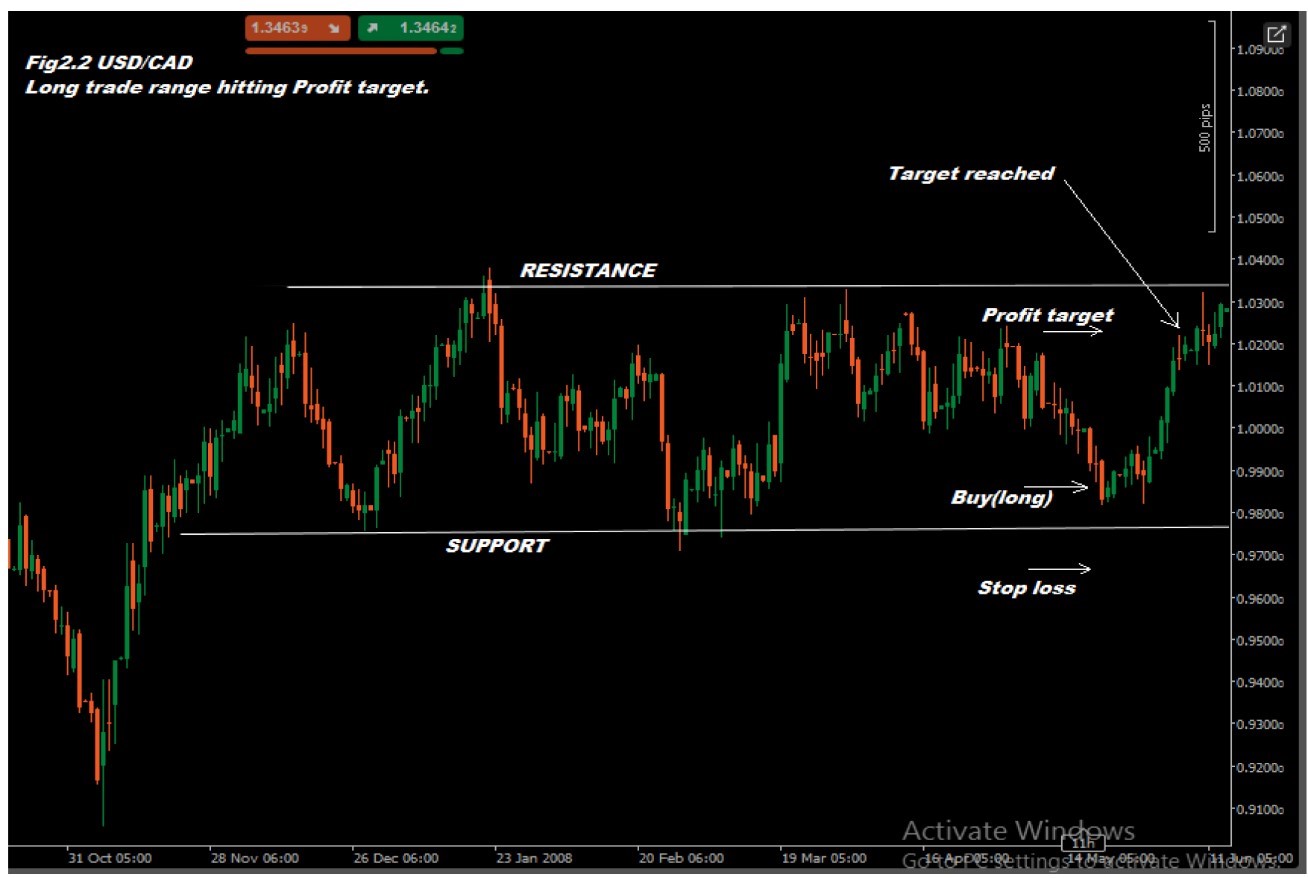
The
main purpose of exiting before the price reaches the top of the range
is
because the resistance level is easily spotted by both retail and
institutional traders alike. It pays to exit earlier since it is not
known how the price will
react once it reaches the resistance level.
Short trade is placed when a bear candle bounces of the resistance level and closes below the resistance level. Then it is good to place a stop loss above the top of the resistance level as it is expected that chances of prices rise above that level is unlikely. The take profit target may be placed about 80% of the range measured from the resistance level. It means that if the distance between support and resistance is 100 pips, the profit target is placed 80 pips away from the resistance. The risk and reward ratio is taken 1:1.
Thus the distance between the entry price and profit target is 50 pips, stop loss should be 50 pips from the entry price. Likewise, if the distance between the entry price of the short position and target profit is 100 pips, the stop loss should be 100 pips from the entry of long position.
The main purpose of exiting before the price reaches the bottom of the range is because the support level is easily spotted by both retail and institutional traders alike. It pays to exit earlier since it is not known how the price will react once it reaches the support level.
That’s just an example, your target profit and stop loss may be placed according to what the market will show you when you start trading.
Those trading
in the Foreign Exchange Market (Forex) rely on the same two basic forms
of
analysis that are used in the Stock Market: Fundamental Analysis and
Technical
Analysis. The uses of technical analysis in Forex are much the same:
price is
assumed to reflect all news, and the charts are the objects of analysis.
But unlike
companies, countries have no balance sheets, so how can fundamental
analysis be
conducted on a currency?
Since
fundamental analysis is about looking at the intrinsic value of an
investment,
its application in Forex entails looking at the economic conditions
that affect
the valuation of a nation’s currency. Here we look at some of the major
fundamental factors that play a role in a currency’s movement.
Economic Indicators:
Economic
indicators are reports released by the government or a private
organization
that detail a country’s economic performance. Economic reports are the
means by
which a country’s economic health is directly measured, but remember
that a
great deal of factors and policies will affect a nation’s economic
performance.
So, how are they used?
Since
economic indicators gauge a country’s economic state, changes in the
conditions
reported will therefore directly affect the price and volume of a
country’s
currency. It is important to keep in mind, however, that the indicators
discussed above are not the only things that affect a currency’s price.
Third-party reports, technical factors and many other things also can
drastically affect a currency’s valuation.
Understanding inflation is crucial in forex trading, particularly in the context of fundamental analysis. Inflation, the rise in the general price level of goods and services, significantly influences currency values and exchange rates. Traders closely monitor central bank policies, as interest rate decisions play a key role in controlling inflation and impacting currency strength. Countries with lower inflation rates generally see their currencies appreciate compared to those with higher inflation. Forex traders analyse economic indicators such as the consumer price index (CPI) and producer price index (PPI) to gauge inflationary pressures. Inflation differentials between currencies, nominal vs. real interest rates, and the impact of inflation on consumer spending are all critical factors considered in fundamental analysis. Additionally, traders assess the influence of inflation on commodity prices, global economic conditions, and overall market expectations to make informed decisions about potential currency movements in the dynamic forex market.
Non-Farm
Payrolls (NFP) are the name given to the data that pertains to the
number of
people who are employed within the US economy, and it is released the
first
Friday of every month by the Bureau of Labour Statistics. Strong
decreases in
employment indicate a contracting economy, while strong increases are
perceived
indicators of a prosperous economy.
Every
first Friday of a new month please observe USD/JPY during the NFP
releasing to
see the movement (if the month starts on a Friday, then it happens on
the next
Friday. The time of release will be seen on the economic calendar). In
chapter
three I will explain how to trade economic news.
The
retail-sales report measures the total receipts of all retail stores in
a given
country. This measurement is derived from a diverse sample of retail
stores
throughout a nation. The report is particularly useful as a timely
indicator of
broad consumer spending patterns that is adjusted for seasonal
variables. It
can be used to predict the performance of more important lagging
indicators,
and to assess the immediate direction of an economy.
Revisions
to advanced reports of retail sales can cause significant volatility.
The
retail sales report can be compared to the sales activity of a publicly
traded
company.
Industrial
Production: this report change in the production of factories, mines
and
utilities within a nation. It also reports their “capacity
utilizations”, the
degree to which each factory’s capacity is being used. It is the deal
for a
nation to see a production increase while being at its maximum or near
maximum capacity utilization.
Traders
using this indicator are usually concerned with utility production,
which can
be extremely volatile since the utilities industry, and in turn trading
of and
demand for energy, is heavily affected by changes in weather.
Significant
revisions between reports can be caused by weather changes, which in
turn can
cause volatility in the nation’s currency.
Consumer Price Index (CPI): the CPI measures change in the prices of consumer goods across over 200 different categories. This report, when compared to a nation’s exports, can be used to see if a country is making or losing money on its products and services.
Be careful, however, to monitor the exports, it is a popular focus with many traders, because the prices of exports often change relative to a currency’s strength or weakness.
The Existing
Home Sales Report is a monthly release covering the number of existing
homes
that were closed during the survey month along with average sales
prices by
geographic region. The “closed” distinction is important because most
closing
periods are anywhere from six to eight weeks, so values listed are
likely to
relate to sales made about two months prior. The data is collected and
released
by the National Association of Realtors.
There are three
important metrics in this report; in addition to the aggregate number
of
existing homes sold and median selling prices, inventory levels are
provided
through the “months” supply figure, a number that represents the length
of time
in months required to burn through all of the existing inventory
measured
during the period.
Data
is provided raw and with seasonal adjustments. This is because weather
is a big
factor in determining month-to-month demand. As with the Housing Starts
Report,
the data is also broken down by geographic region (Northeast, Midwest,
South
and West). Price data will show percentage changes from the
year-over-year
period and the prior month.
GDP is
considered the broadest measure of a country’s economy, and it
represents the
total market value of all goods and services produced in a country
during a
given year. Since the GDP figure itself is often considered a lagging
indicator, most traders focus on the two reports that are issued in the
months
before the final GDP figures: the advance report and the preliminary
report.
Significant revisions between these reports can cause considerable
volatility.
The
GDP is somewhat analogous to the gross profit margin of a publicly
traded
company in that they are both measures of internal growth.
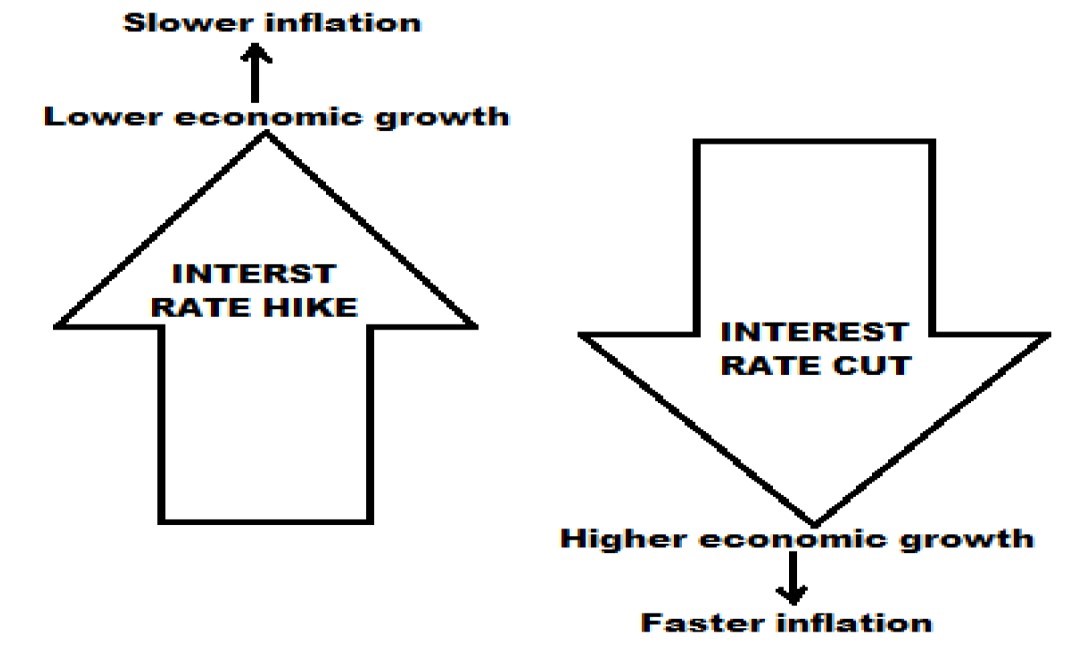
The higher
Interest Rates that can be earned tend to attract foreign investment,
increasing the demand for and value of the home country’s currency.
Conversely,
lower interest rates tend to be unattractive for foreign investment and
decrease the currency’s relative value. Simply put, interest rates make
the
Forex world go ’round!
In other
worlds, the Forex Market is ruled by interest rates. A currency’s
interest rate
is probably the biggest factor in determining the perceived value of a
currency. So, knowing how a country’s central bank sets its monetary
policy,
such as interest rate decisions, is a crucial thing to wrap your head
around.
One of the biggest influences on a central
bank’s interest rate decision is price stability, or “Inflation”.
Inflation is a
steady increase in the prices of goods and services.
Inflation is the reason
why your parents or your parents’ parents paid a nickel for a soda pop
in the 1920’s, but now people pay
twenty times more for the same product.
It’s generally accepted
that moderate inflation comes with economic growth.
However,
too much inflation can harm an economy and that’s why central banks are
always
keeping a watchful eye on inflation-related economic indicators, such
as the
CPI and PCE.
Trade
balance measures the ratio of exports to imports for a given
country’s economy. If exports are higher than imports (a trade
surplus), the
trade balance will be positive. If the imports are higher than exports
(a trade
deficit), the trade balance will be negative.
Knowing
the exchange rate is obviously critical for any foreign exchange
trader, but information on the net exports in a country can help to
predict
future trends in inflation and foreign investment, and thus can give
clues to
the future behaviour of any given currency market.
Trade
balance is derived primarily from three factors: The price of
goods in a country; Tax and tariff levies on imported or exported
goods; and
the exchange rate between two currencies.
This
last factor is fundamental to foreign exchange trading. Since the
trade balance depends so heavily on the current state of exchange rates
between
two countries, trade balance is a key coincident indicator for the
state of a
foreign exchange asset market.
There
are a number of measures for trade balance, but one of the chief
sources of information on the state of trade in the US is the
International
Trade report released monthly by the Cenus Bureau and the Bureau of
Economic
Analysis.
This
report is released around the third week of every month and details
the performance of several exported goods and services in various
sectors of
the economy.
Congratulations! You have completed the chapter two.
© 2024 ETS ROIX. All rights reserved.